Articles
What’s New in SPSS Statistics v29.0.1?
Looking to quickly learn what’s new in IBM SPSS Statistics 29.0.1?
Take a Tour of What’s New in IBM SPSS Statistics
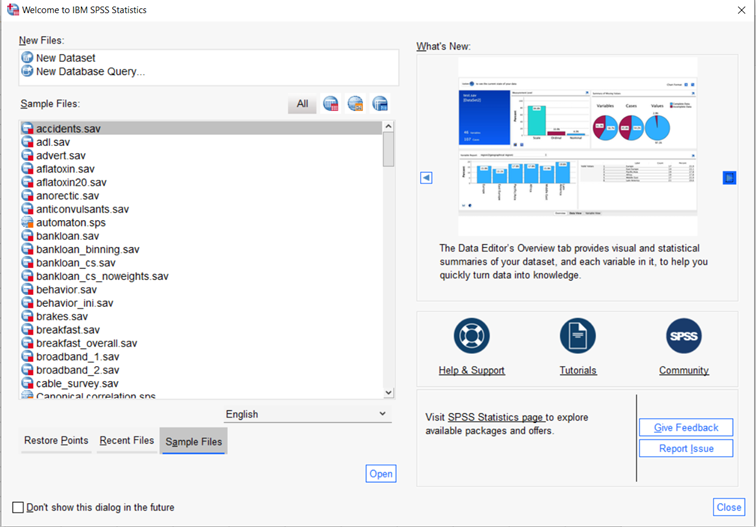
To learn what’s new in IBM SPSS Statistics Version 29.0.1, click the File menu and select the Welcome Dialog option. On the right side of the Welcome Dialog box is the What’s New section. Here you can click through new features in IBM SPSS Statistics using the arrow buttons.
The Overview Tab
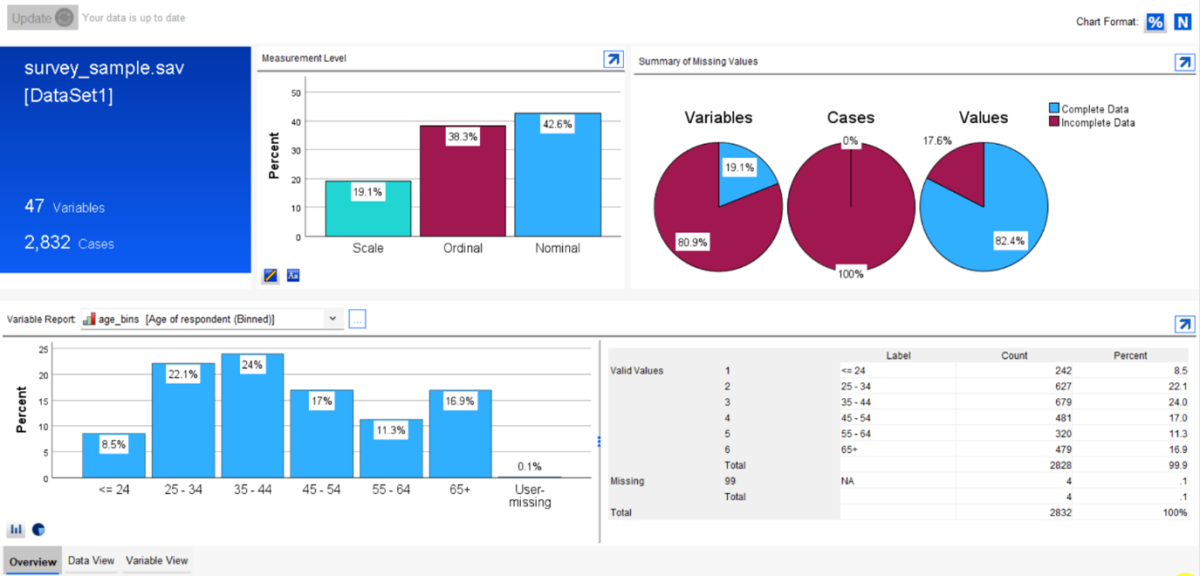
The tour starts with the Overview tab, which provides a complete visual and statistical overview of your data. The Overview tab is next to the Data View tab.

The Overview Tab provides information on measurement levels in your data, missing data and variable reports.
PRESS Statistic
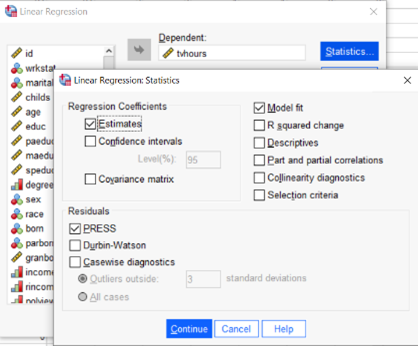
The next new feature shown in the What’s New tour is the addition of the PRESS (Predicted Residual Sum of Squares) statistic in linear regression output. This is a cross-validation statistic for linear regression models. To obtain this statistic, go to Analyze > Regression > Linear to set up your regression analysis. Click on the Statistics button and tick the PRESS statistic. The statistic will appear in the Model Summary table in your output.
Youden’s Index
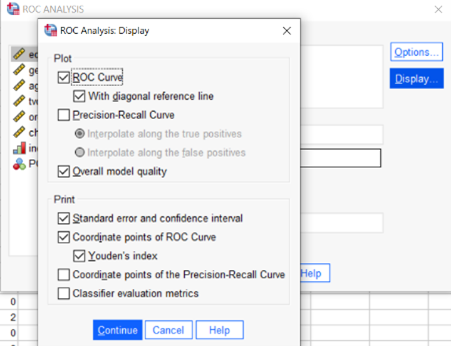
Youden’s Index follows in the What’s New tool. This is a summary measure of a ROC curve and is defined by Sensitivity – (1-Specificity). To obtain this statistic, go to Analyze > Classify > ROC Analysis. Click the Display button to request Youden’s Index.
Percentiles
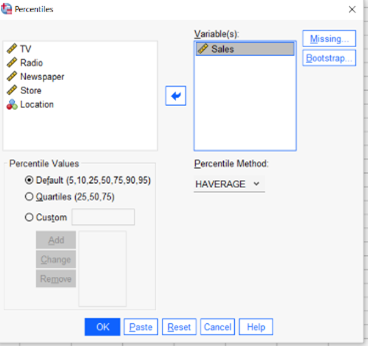
Percentiles is a new feature in the Descriptive Statistics menu and the Explore procedure. Go to Analyze > Descriptive Statistics > Percentiles and select desired Percentile Values and Percentile Method.
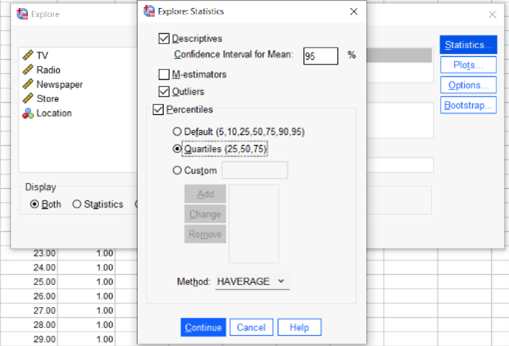
In the Explore procedure, users can click the Statistics button and select Percentiles.
Save EBLUP (Empirical Best Linear Unbiased Predictions)
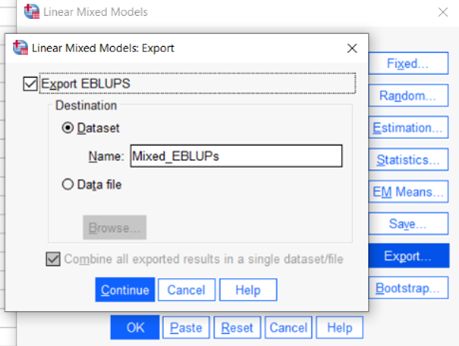
Users can now export random effects predictions (EBLUPs) to datasets or files when estimating mixed models. Go to Analyze > Mixed Models > Linear, and when one or more random specifications request the display of random effects predictions, click the Export button. Users will have the option to create new datasets or files with the EBLUPs. The same options are available in the Generalized Linear procedure. (Analyze > Mixed Models > Generalized Linear).
Computation of Multiple Time-Dependent Covariates in Cox Regression
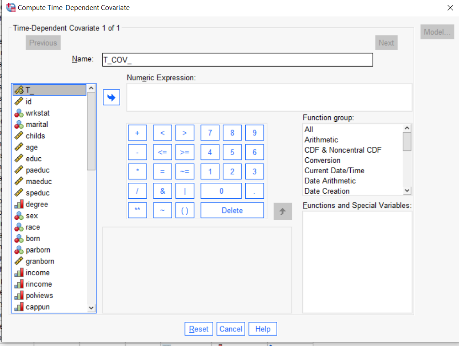
Users can now compute multiple time-dependent covariates in Cox Regression. Go to Analyze > Survival > Cox w/ Time-Dep Cov to access the dialog box.
SURVREG RECURRENT Procedure
Statistics now has Parametric Survival Regression models for recurrent events data. To use this procedure, click Analyze > Survival > Parametric Shared Frailty Models to estimate parametric survival models for recurrent events data by incorporating a shared frailty term. This term is treated as a random component to account for an unobserved effect due to individual or group-level variability.
More Changes: Output Modifications
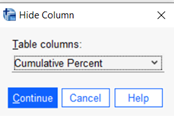
There have been additional changes to Output. Users can now right-click on a pivot table and use Modify Output. Users can transpose, sort, hide columns, and highlight cells. For example, right-click on the table to hide columns and select Modify Output > Hide Column.
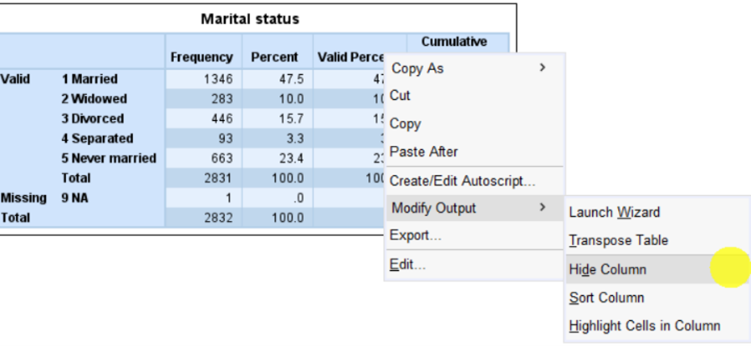
Select the table column you want to hide.
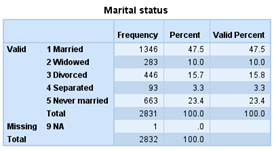
Now you will have your new table.
More Changes: Enhanced Search Dialogue
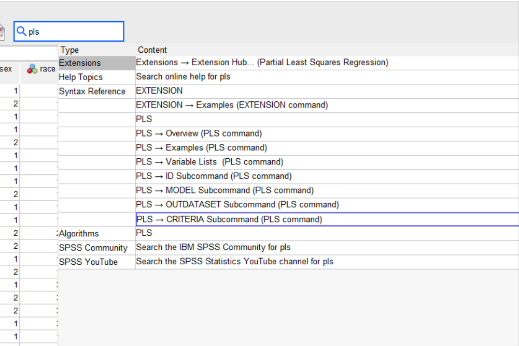
There are also changes to the Search tool. These changes include searching for variables, the IBM SPSS Community, and more. For example, searching for PLS Regression provides several options, including Extensions, Help, Syntax Reference, Algorithms, and the SPSS Community.
Summary
There are multiple changes in IBM SPSS Statistics version 29.0.1. The Overview Tab provides a complete visual and statistical view of data. Additional procedures and statistics include the PRESS statistic for linear regression, Youden’s Index, Percentiles, saving EBLUPs, computation of multiple time-dependent covariates for Cox Regression models, Parametric Survival Regression models for recurrent events data, new output options and enhanced search features.
In addition to the most recent changes to IBM SPSS Statistics, R and Python are installed with SPSS. The Extensions Hub provides users access to over 60 analytical techniques that can be installed into SPSS. These changes, combined with the existing statistical procedures, make Statistics a complete and comprehensive statistical platform.
Version 1’s experienced consultants are on hand to help you understand your SPSS needs – from consultancy and training to finding the best software and license type for your analytical and usage requirements. Contact us to discuss your requirement and identify the best SPSS solution for you.
Related Articles
Take a look through our SPSS Articles covering a broad range of SPSS product and data analytics topics.


