Articles
The Value of Codebook in IBM SPSS Statistics
Survey researchers often face many data preparation challenges. These can range from integrating files from different formats to data cleaning, exploration, and transformation. In addition to these tasks, having a complete report of the data file, both before and after data preparation, is essential to provide a record of the data and ensure consistent data management.
Codebook is a valuable resource that presents a comprehensive overview of dictionary information about variables and multiple response sets within a dataset. It contains crucial data details, such as variable names, variable labels, variable types, value labels, missing values, and summary statistics. The summary statistics for nominal and ordinal variables and multiple response sets include counts and percentages, while the summary statistics for scale variables comprise mean, standard deviation, and quartiles.
Although critical, running and saving a Codebook can be overlooked in favour of running initial descriptive statistics and data preparation steps. Running descriptives on each variable can be time-consuming, so having a quick and comprehensive data overview saves time. By starting with a Codebook procedure, analysts have a powerful tool they can use to verify and record the quality and accuracy of data.
Creating a Codebook for Data in IBM SPSS Statistics
To access the Codebook feature in SPSS, follow these straightforward steps:
- Begin by selecting Reports from the Analyze menu. Next, select Codebook to access the procedure.
- Once in the Codebook procedure, navigate to the Variables tab and choose the variables to include. Multiple response variables can also be included if necessary.
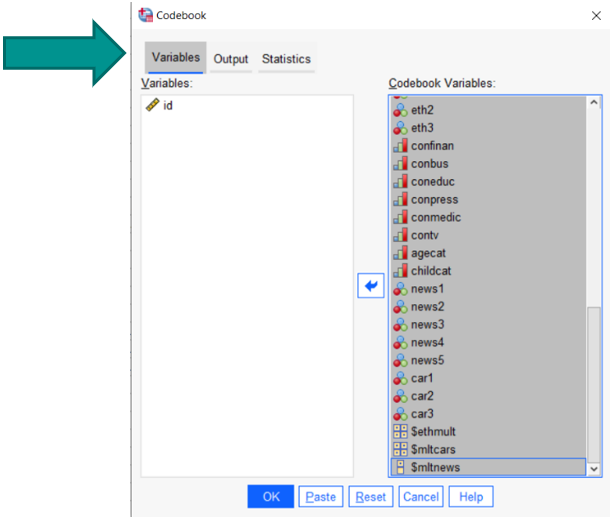
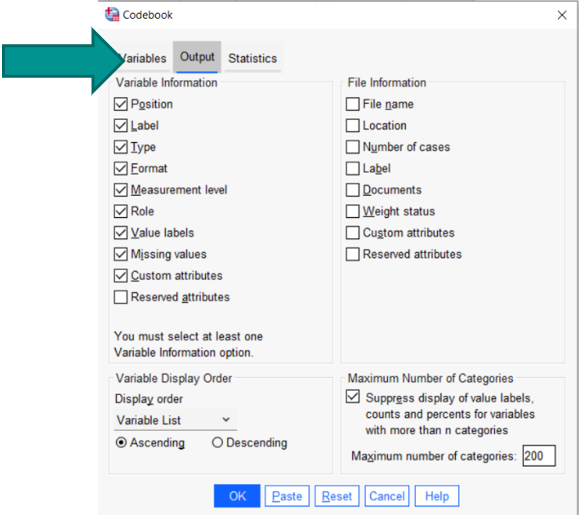
- To control the Codebook output, select the Output tab. Here, you can choose which Variable Information and File information to display and control the Variable Display Order.
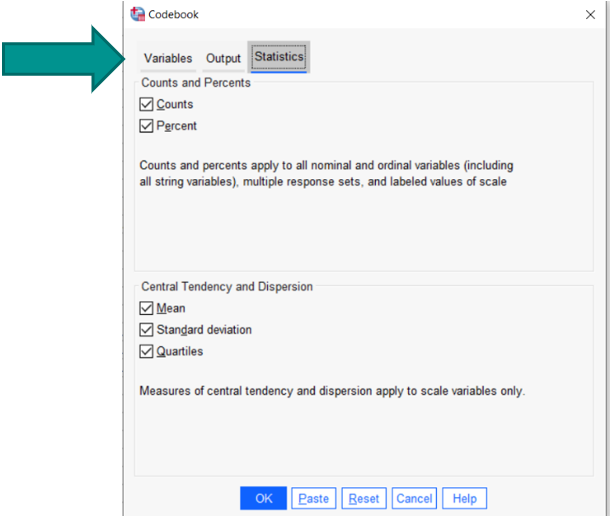
- Lastly, go to the Statistics tab to select Counts and Percents, as well as measures of Central Tendency and Dispersion.
By following these simple steps, you can easily use the Codebook feature in SPSS and create a comprehensive report.
Examining Output from Codebook
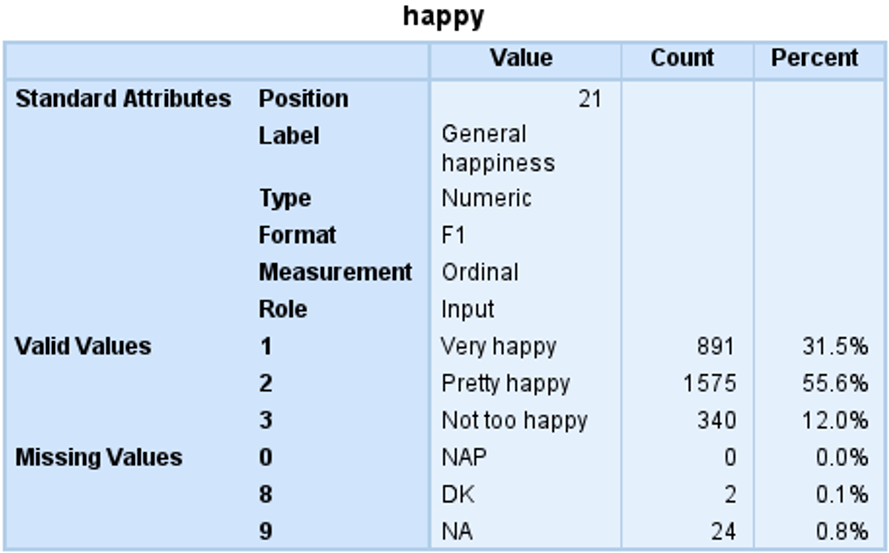
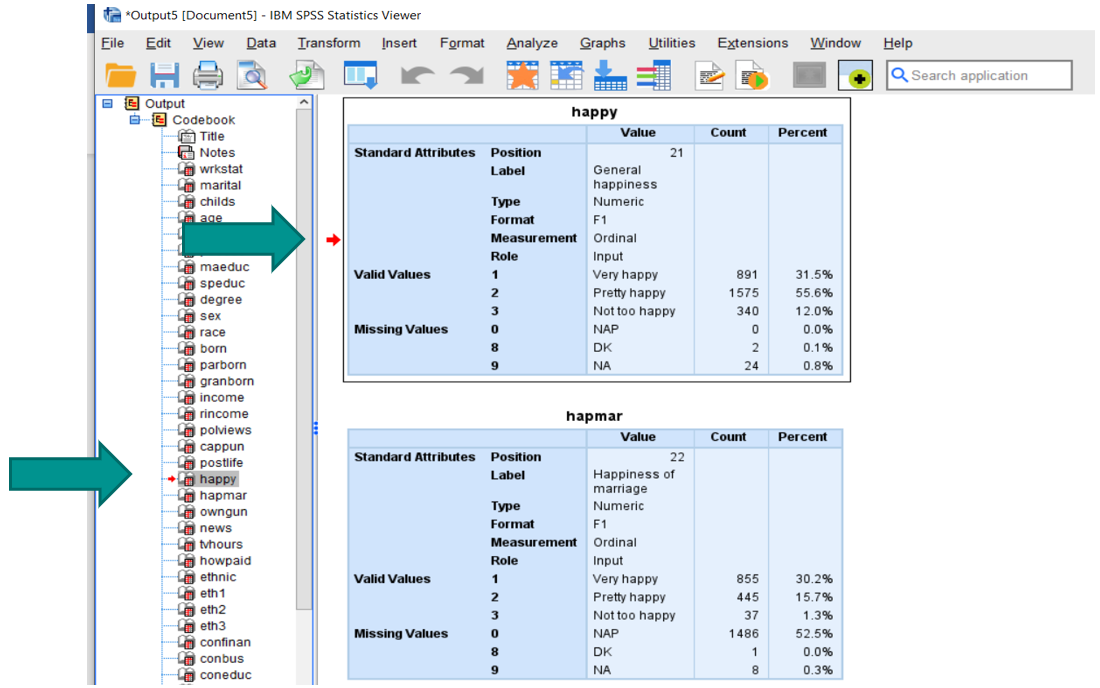
In Codebook output, each variable is listed in detail. Nominal and ordinal variables show counts and percentages. For example, the output for the variable ‘happy’ (self-reported happiness) shows:
- Variable Position (Column 21)
- Label (‘General Happiness’)
- Type (Numeric)
- Format (F1)
- Measurement (Ordinal)
- Role (Input – used for automated modelling procedures)
- Valid Values (codes and labels)
- Missing Values (codes and labels).
With Codebook, you can also check the distribution of happiness, the accuracy of the codes for each category, and the amount of missing data, see below:
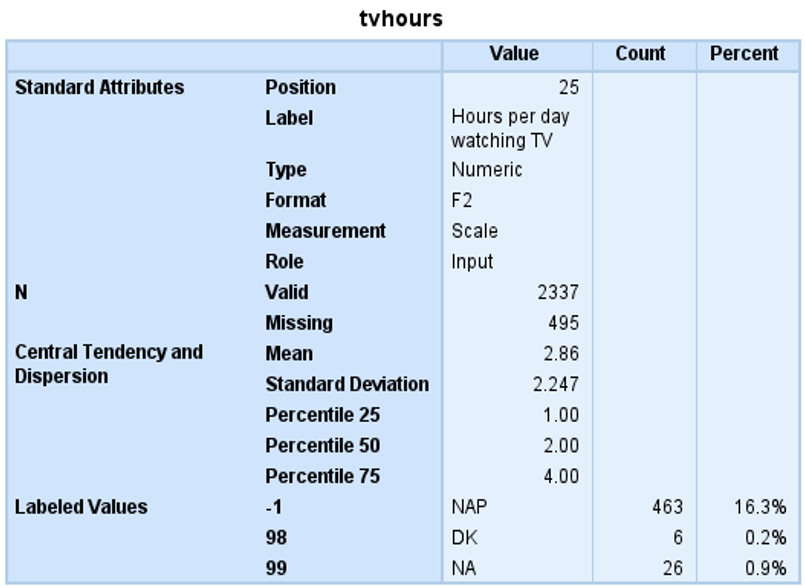
The output for scale variables provides measures of central tendency and variation. The output for the variable ‘age’ shows:
- Position (Column 25)
- Label (‘Hours per day watching TV’)
- Type (Numeric)
- Format (F2)
- Measurement (Scale)
- Role (Input)
- Valid cases (2337)
- Missing cases (495)
- Mean
- Standard Deviation
- Percentiles
- Labeled Values (-1 = NAP, 98 = DK, 99=NA). For Labeled Values we also see Count and Percent.
Again, analysts can review the statistics for this variable, labelled values, and missing data, see below:
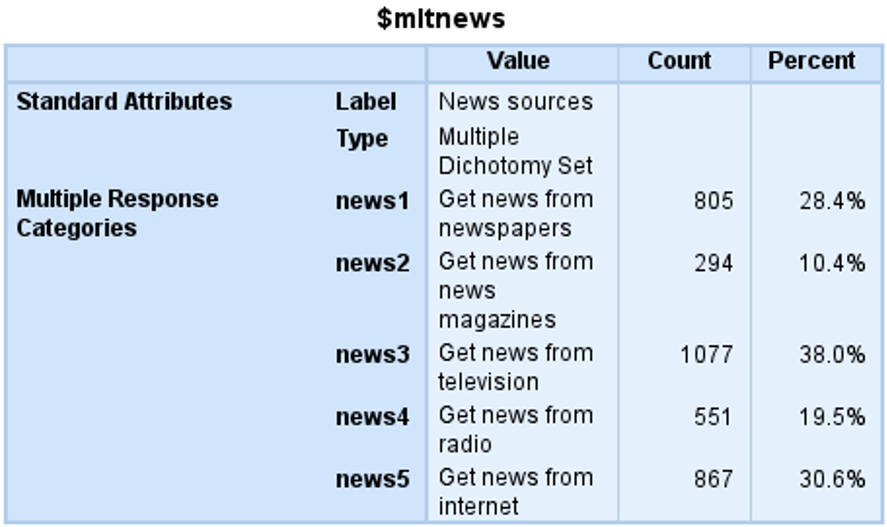
Codebook also provides information about multiple response variables. Below is a multiple response variables created within the dataset. Respondents were asked to select the sources they use for news. The Codebook shows the count and percentages for each multiple-response selection, see below:
Navigating Codebook Output and Exporting the Report
To navigate Codebook output, users can use the outline navigator on the left side of the output window. Each variable included in the Codebook procedure appears in the outline navigator. You can move through the outline and click on the variable you are interested in. Clicking on the variable takes you to the Codebook output.
To export your output, simply click on Output at the top of the outline to highlight all output.
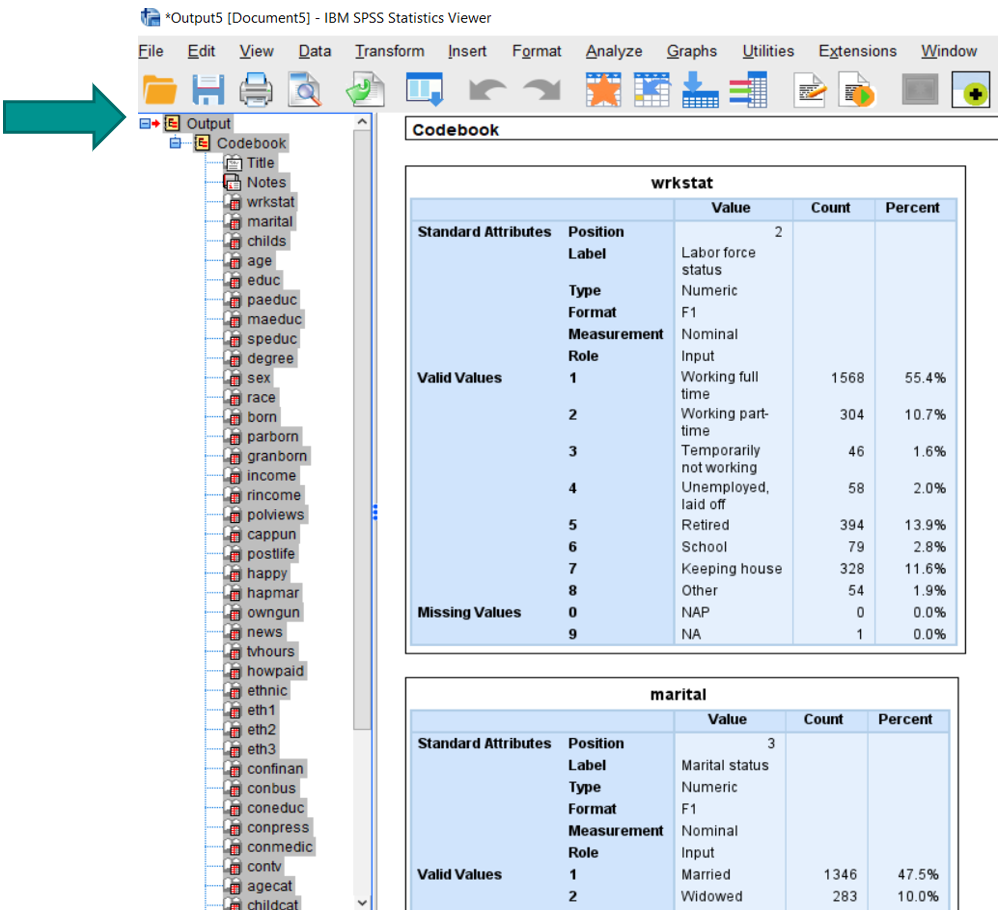
Once you have highlighted your output, right-click, and select Export.
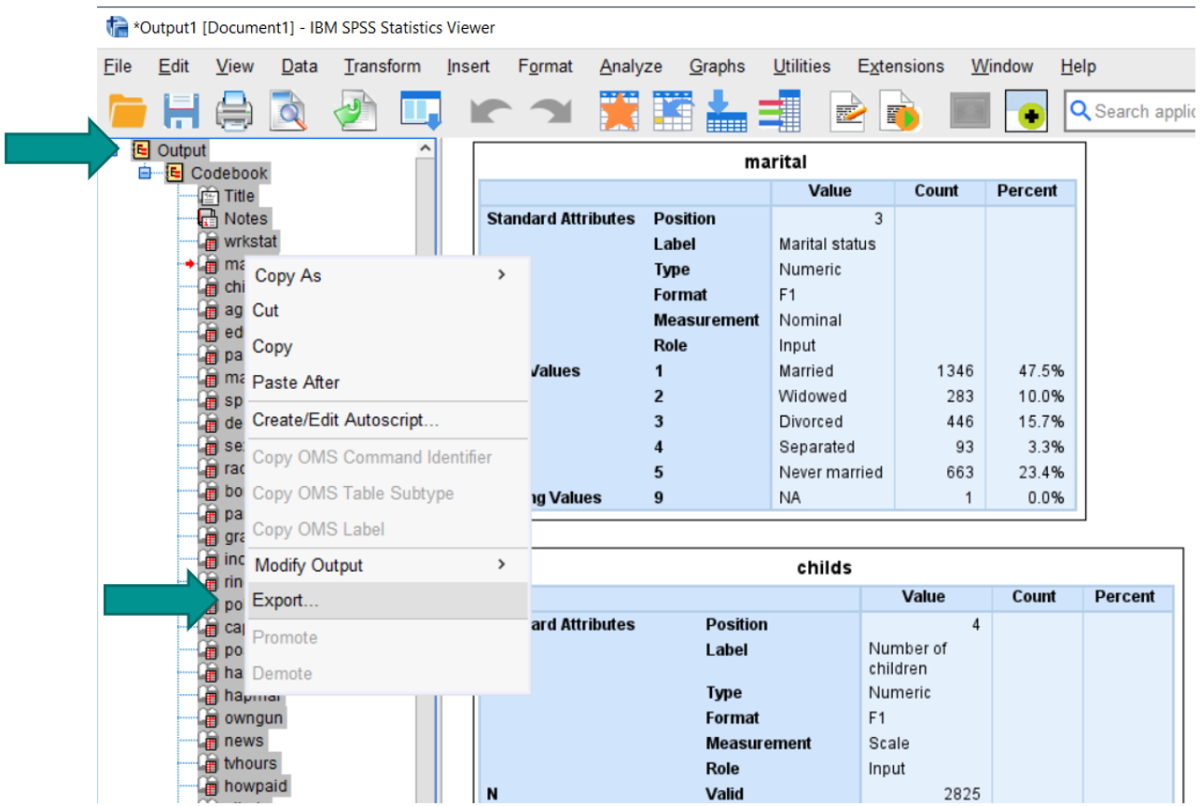
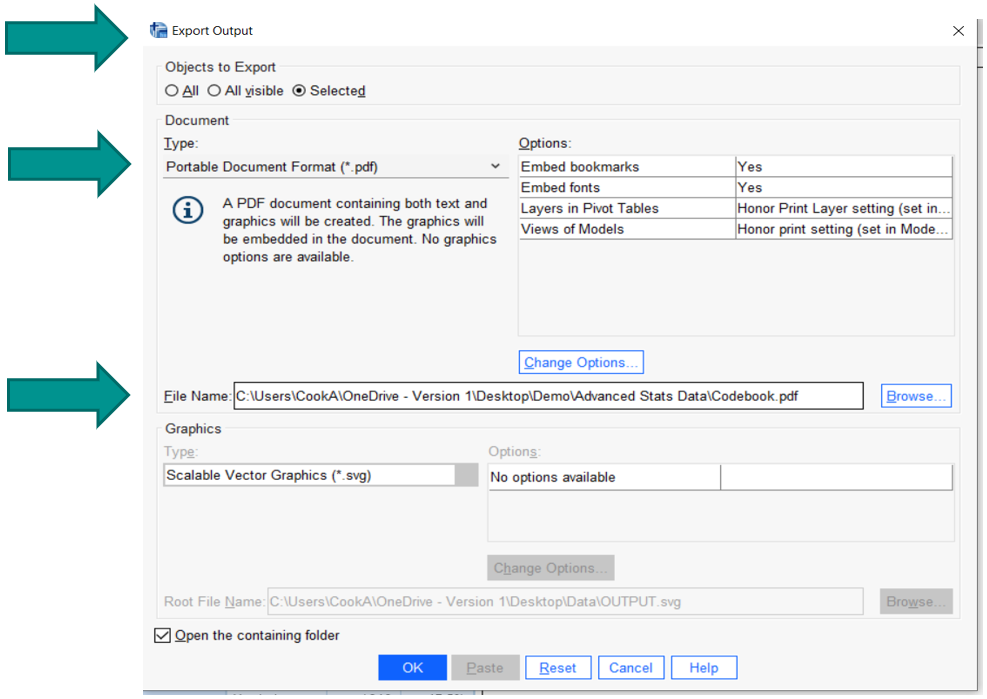
This will bring up the Export Output box. You can indicate the type of export document and location. Once you have made these selections, click OK to export.
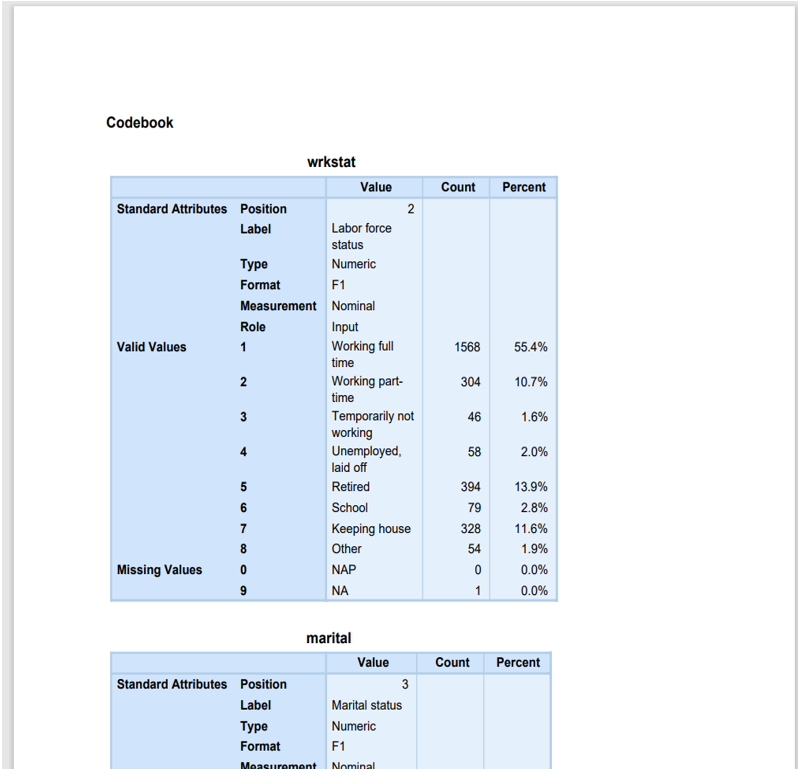
Now you have the dataset in the file format that you need. In this example, Codebook was exported to a pdf file which can be shared with other users.
Summary
Running a Codebook in IBM SPSS Statistics is a simple and straightforward process. Just select the variables you want to include and review the findings. Codebook offers a range of analysis options, including codes and labels, distributions, counts, percentages, measures of central tendency, and missing data. Saving and exporting the output is also effortless. By running Codebook, examining the results, and saving the report, you can achieve a comprehensive overview of your data that ensures the accuracy of your information and subsequent analyses.
Version 1’s experienced consultants are on hand to help you understand your SPSS needs – from consultancy and training to finding the best software and license type for your analytical and usage requirements. Contact us to discuss your requirement and identify the best SPSS solution for you.
Related Articles
Take a look through our SPSS Articles covering a broad range of SPSS product and data analytics topics.


